First LOTUS workshop
→
Europe/Paris
Room 108, Tower 45, Corridor 44-54 (1st floor) (Université Pierre et Marie Curie, Paris)
Room 108, Tower 45, Corridor 44-54 (1st floor)
Université Pierre et Marie Curie, Paris
4 place Jussieu, 75005 Paris, France
Description

LOTUS is an international research initiative endorsed by SPARC, IO3C and WMO (GAW) that kicked off at the Quadrennial Ozone Symposium in 2016. LOTUS focuses on revisiting the estimates and understanding of Long-term Ozone Trends and Uncertainties in the Stratosphere, in preparation for the WMO/UNEP 2018 Ozone Assessment. More detailed information on LOTUS can be found at our main website.
LOTUS will hold its first workshop mid March 2017 in Paris, France. This invite-only workshop will be informal with selected scheduled oral presentations and with ample time for discussions in large or small groups.
Main objectives
- Status update of the activities within the MIDI (production of time series) and ROAST working group (regression analyses of time series).
- Discussion of first results, where to head next and planning of the remaining work.
- Discussion and planning of LOTUS report.
- Identification of open issues and scope of LOTUS.
We gratefully acknowledge the support by
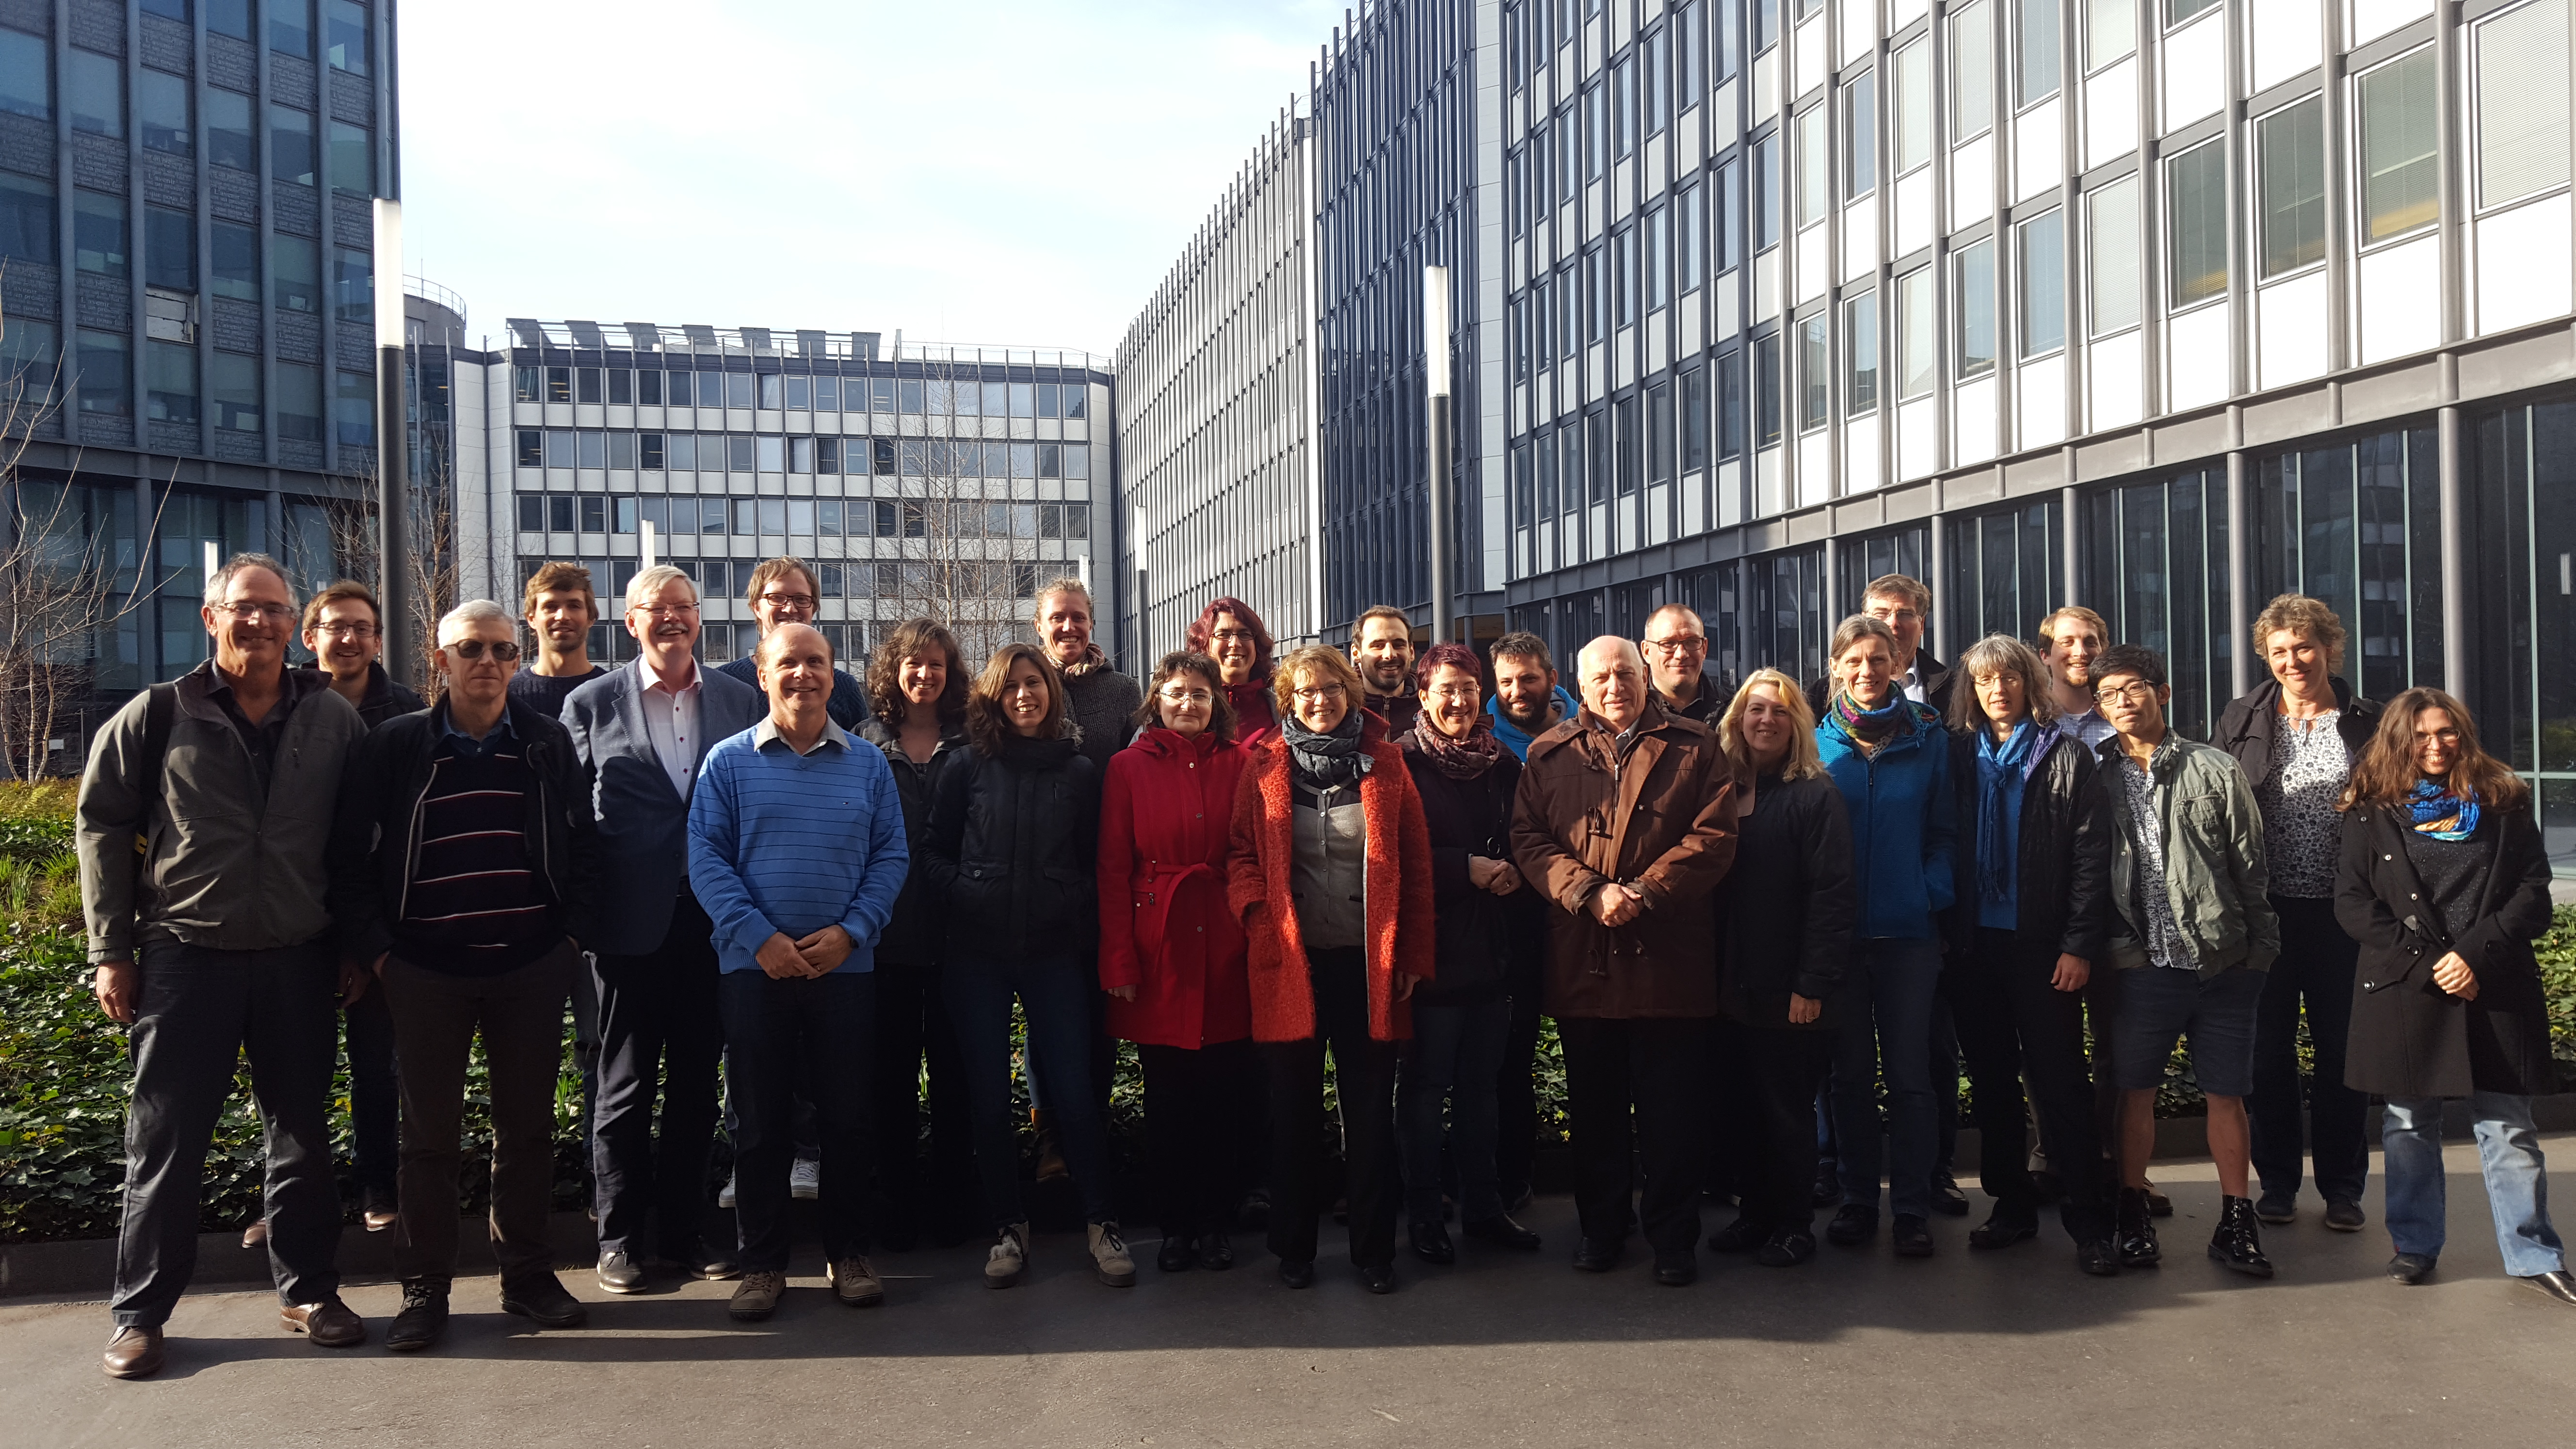
Group picture
Participants
Aleksandr Gruzdev
Alexandra Laeng
Birgit Hassler
Christos Zerefos
Corinne Vigouroux
Daan Hubert
Doug Degenstein
Eliane Maillard Barras
Fiona Tummon
Herman Smit
Irina Petropavlovskikh
Jeannette Wild
John Kapsomenkis
Justin Alsing
Kai-Lan Chang
Kaley Walker
Kleareti Tourpali
Lucien Froidevaux
Mark Weber
Massimo Valeri
Melanie Coldewey-Egbers
Michael Schwartz
Michelle Santee
Peter Braesicke
Robert Damadeo
Sophie Godin-Beekmann
Stacey Frith
Viktoria Sofieva
William Ball
Wolfgang Steinbrecht
-
-
10:00
→
12:00
Preparation (LOTUS coordination team) Small LATMOS meeting room, 3rd floor, corridor 45-46
Small LATMOS meeting room, 3rd floor, corridor 45-46
-
13:00
→
13:30
Registration Room 108, 1st floor, C 44-54
Room 108, 1st floor, C 44-54
-
13:30
→
15:10
Welcome, meeting objectives, status LOTUS Room 108, 1st floor, C 44-54
Room 108, 1st floor, C 44-54
-
13:30
Welcome and meeting logistics 10mSpeaker: Dr Sophie Godin-Beekmann (CNRS)
- 13:40
- 14:00
- 14:30
- 14:50
-
13:30
-
15:10
→
15:30
Coffee and tea 20m
-
15:30
→
17:30
Presentations by LOTUS participants Room 108, 1st floor, C 44-54
Room 108, 1st floor, C 44-54
- 15:30
-
15:50
Updated and new GOZCARDS ozone data records 20mWe have updated the Global Ozone Chemistry and Related Trace gas Data Records for the Stratosphere (GOZCARDS) data (see Froidevaux et al. [2015]) with yearly netCDF files (2013-2016) of merged monthly zonal mean ozone mixing ratio profiles versus pressure. For this ongoing merged satellite record, we have updated the public records (version 1 GOZCARDS ozone data, originally produced for 1979-2012) with Aura MLS data from 2013 through 2016; for 2015 and 2016, we adjusted MLS v4.2 zonal means to match MLS v2.2 data, in order to extend the original GOZCARDS mixing ratios (based on v2.2) in a homogeneous way. All GOZCARDS merged data files (including those mentioned below) also include standard deviation and standard error profiles, along with other information/metadata. A new GOZCARDS record (version 2.2, 1979-2016) was produced in a way similar to the creation of the original GOZCARDS data, but on twice as fine a pressure grid in the stratosphere, by using updated HALOE, SAGE-I, SAGE-II, and Aura MLS data sets on this finer grid. Furthermore, as there was some interest in a data set using just HALOE and Aura MLS mixing ratios versus pressure, we also produced this type of new GOZCARDS data record (version 2.1 for 1991-2016) on the finer vertical grid. We briefly discuss some comparisons among the above GOZCARDS data records, as well as between GOZCARDS and other long-term merged ozone data sets (e.g., the Stratospheric Water and OzOne Satellite Homogenized (SWOOSH) data set, see Davis et al. [2016]).Speaker: Dr Lucien Froidevaux (Jet Propulsion Laboratory, California Institute of Technology)
-
16:10
The merged SAGE II, Ozone_cci and OMPS ozone profiles for trend studies 20mWe present the merged monthly zonal mean ozone profile data set for trend analysis. The dataset is created using data from SAGE II, OSIRIS, GOMOS, MIPAS, SCIAMACHY, ACE-FTS and OMPS satellite instruments. In this presentation, we explain the merging method, show examples of data and a preliminary analysis of trends in the vertical distribution of ozone.Speaker: Dr Viktoria Sofieva (Finnish Meteorological Institute)
-
16:30
Particle filtering as a possible technique with which to build a reliable ozone composite 20mAccurate estimation of decadal trends in stratospheric ozone requires combining observations from multiple instruments. However, the trends derived from different composites disagree due to artefacts in the underlying instrument data or in the merging procedures. We offer an approach to remove these artefacts by applying particle filtering using only the data itself in addition to prior knowledge about ozone variability and known problems during instrument operation. This method, when combined with additional information from instrument PIs, could provide a solution to many of the issues that lead to different decadal trend estimates from the various ozone composites.Speaker: Dr William Ball (PMOD/WRC Davos & IAC/ETH Zurich)
-
16:50
Update of ozone profile trends from WMO 2014 20mI'll give a short update on ozone profile trends obtained using the same methodology as in WMO 2014, that is based on monthly zonal mean anomalies or monthly station mean anomalies. I'll use merged satellite data (SBUV-NASA, SBUV-NOAA, GOZCARDS, SWOOSH, SAGE2+OSIRIS) and NDACC station data. I can also say a few words about the regression used.Speaker: Wolfgang Steinbrecht (Deutscher Wetterdienst)
-
17:10
On the interpretation of ozone trends derived from multi-linear-regression approaches 20mSince ozone depleting substances (ODS) started their decline in the late 1990s, stratospheric ozone is expected to recover. Sofar a statistical significant increase as usually derived from statistical regression models has not been observed in total ozone. Nevertheless, total column ozone has levelled off and in the upper stratosphere an ozone increase is evident, both documenting the success of the Montreal Protocol. Despite this, the proper interpretation of trends from multi linear regression (MLR) is not as straight forward as it seems as other processes that show variations on longer time (decadal) scales, that are possibly linked to climate change, also play a role. In this presentation we want to discuss the limitations of MLR (selection of contributing terms, different ways of describing the trends: EESC vs linear, uncertainties due to instrument drifts) and summarise on attributions of varying trends observed in different regions of the atmosphere in the recent decade.Speaker: Dr Mark Weber (University of Bremen)
-
17:30
→
19:00
Drinks + posters LATMOS, UPMC
LATMOS, UPMC
-
17:30
Accounting for autocorrelation in linear multivariate regression: Different procedures 1h 30mAn autocorrelation, or serial correlation, affects values of regression coefficients and their confidence intervals estimated from a linear multiple-regression model. Usual way to account for the autocorrelation is the iterative Cochrane-Orcutt procedure that assumes that residuals (errors) are a 1-st order autoregressive process. Applying this procedure one assumes that it converges to a global minimum of the residual sum of squares. Another way is to solve directly matrix equations of a multivariate regression problem. If the serially correlated errors can be presented by an autoregressive process then the matrix exists which transforms correlated errors to uncorrelated errors. This matrix is related to the autocorrelation matrix of the autoregressive process. Given the autocorrelation matrix, regression coefficients and their errors can be calculated. One advantage of this procedure is that the order of autoregression accounting for autocorrelation of the residuals can take large values. This report presents analysis of the residuals corresponding to multivariate regression to SBUV MOD 6 data after applying the two procedures. Autoregression order 1 is used in both cases. Spectral analysis of the residuals derived with the use of the Cochrane-Orcutt procedure shows that the residuals usually contain low-frequency variations. For example, the residuals corresponding to the lowest (32 hPa) level in the tropical belt (20S-20N) undergo variations with periods of about 20, 50, and 110 months. When one uses the second procedure to account for the autocorrelation, the long-period variations are absent in the residuals. It should be noted however that although the direct procedure has the advantage of more correct presentation of the “uncorrelated” errors, the estimates of the linear trends of ozone, at least for the data used, are close to each other for the two procedures.Speaker: Dr Aleksandr Gruzdev (A.M. Obukhov Institute of Atmospheric Physics)
-
17:30
Evaluation of ozone profile record at NDACC Alpine station 1h 30mVarious measurement techniques have been deployed for the monitoring of ozone vertical distribution at Haute-Provence Observatory (44°N, 6°E) within the Network for the Detection of Atmospheric Composition Changes (NDACC) since the 1980s. These techniques include ozone lidars, balloon soundings and Dobson Umkehr measurements. This presentation will review the performance of the various experimental techniques deployed at OHP in terms of long-term trend evaluation, with a particular focus on the recovery period starting at the end of the nineties. Comparisons with long-term time series obtained at nearby stations in the so-called NDACC Alpine station and with satellite data will be performed. Regarding trend evaluation, the main factors explaining the recent evolution of ozone, as a function of altitude, will be documented.Speaker: Dr Sophie Godin-Beekmann (LATMOS/OVSQ, CNRS, UVSQ)
-
17:30
Long-term stability of the SOMORA microwave radiometer ozone data record 1h 30mThe microwave radiometer (MWR) SOMORA, operated continuously since 2000 in the framework of the NDACC, is measuring ozone profiles from the stratosphere up to the lower mesosphere with a temporal resolution of 30 min to 1h, providing a dataset which suits to the investigation of the annual and seasonal fluctuations as well as of the diurnal variations of the stratospheric ozone profiles. The ozone volume mixing ratio profiles are retrieved by optimal estimation and a complete error characterization can be obtained on a profile per profile basis in the frame of the retrieval. Multi-instrument comparison analyses are essential to assess the long-term stability of data records by estimating the drift and the bias of instruments. The SOMORA ozone profile dataset has been compared to the profiles measured by the GROMOS MWR in Bern, and by satellites (MLS, MIPAS, HALOE, SCHIAMACHY, GOMOS). The long-term stability of the timeserie and the mean biases in function of time have been estimated. The data set has been homogenized accounting for system modifications in 2005 and 2009 and ensuring a constant measurement contribution to the retrieved ozone profiles up to 60 km. Comparisons of the most recent data revealed a positive anomaly of the SOMORA ozone measurements in 2015 and 2016. A calibration hot load issue in 2015 has been discovered, and the dataset has been reprocessed. Timeseries of ozone anomalies will be presented showing a clear improvement of the 2015 to 2016 consistency with the other ground-based instruments and with the satellites. Impact of the sampling on ozone trends has been investigated by deriving annual trends of hourly profiles. In the high stratosphere, diurnal trends and nocturnal trends show a significant difference while in the middle stratosphere, smaller differences between morning and afternoon trends are noticed.Speaker: Eliane Maillard Barras (MeteoSwiss)
-
17:30
Ozone trend estimation using MIPAS ESA Level 2 Version 7 data 1h 30mThe largest part of the Earth's atmosphere ozone is located in the stratosphere, forming the so-called ozone layer. This layer played a key role in the development of life on Earth and still protects the planet from the most dangerous ultraviolet radiation. After the discovery of the high ozone depletion potential of some anthropogenic origin substances (e.g. chlorofluorocarbons), some limitations in the production of the major ozone-depleting substances (ODS) have been applied with the Montreal Protocol in 1987. The reduction of the ODS concentrations in the stratosphere started in the mid-1990s and, thereafter, the stratospheric ozone layer should have started its recovery. In the attempt to detect this recovery we use the Michelson Interferometer for Passive Atmospheric Sounding (MIPAS) measurements to estimate the stratospheric ozone trend in the mission period (July 2002 - April 2012). In particular, we use MIPAS products generated with Version 7 of the Level 2 (L2v7) algorithm operated by the European Space Agency. The L2v7 data are based on the MIPAS Level 1b radiances Version 7. These radiances are calculated with an improved radiometric calibration that exploits a time-dependent non-linearity correction scheme. After this correction the residual drift of the calibration error is smaller than 1 % across the entire mission, thus allowing to determine accurate trend estimates.Speaker: Dr Massimo Valeri (University of Bologna - Department of Physics and Astronomy)
-
17:30
SBUV Profile MOD Uncertainty Estimates 1h 30mWe use a monte carlo approach to estimate the uncertainty resulting from the merging process in the SBUV-based merged profile ozone data record (SBUV MOD). This is a continuation of a similar analysis approach applied to the total ozone MOD data set (Frith et al., 2014). Differences between the individual SBUV records are larger in the profile, as they tend to cancel in the column total. Nevertheless the differences among the instruments tend to be smaller than those relative to independent data sources. Our analysis does not allow us to reliably identify an outlier, thus we choose to keep all instruments and average them out in the MOD. In this work we test various approaches to modelling the observed differences among SBUV instruments using the monte carlo framework. Our goal is to refine our uncertainty estimates in the profile ozone while maintaining consistency with the total ozone uncertainty estimates. We also present regression model results from the LOTUS 'test' time series analysis, which was based on SBUV MOD.Speaker: Mrs Stacey Frith (SSAI)
- 17:30
-
17:30
Trends in the stratosphere from collocated lidar, space and model simulations 1h 30mIn view of differences found in earlier papers between trends in the lower and upper stratosphere, the presentation focuses on the intercomparison between model and observations. Results will be presented for the limited period from 1997 to 2011 comparing deseasonalized and de-QBOed lidar and SBUV/2 overpasses at Haute-Provence, Hohenpeissenberg, Table Mountain, Mauna Loa and Lauder with model simulations centered at each lidar station. The model we had available is Oslo CTM3 during the same period. This model is now being expanded to cover the period 1990-2015 whose simulations will be available in about 2 months from now. It was found a good match between the profiles derived from different methods. The same holds when comparing trends particularly from 100 hPa up to 3 hPa (about between 16 up to 40 km). Exception in the trends comparison is Mauna Loa between 10 and 5 hPa. The calculations were repeated with and without the QBO and the differences in the trends were on the order of 1% of the trend which is small. Statistical significance and possible mechanisms involved will be discussed.Speaker: Prof. Christos Zerefos (Academy of Athens)
-
17:30
Uncertainty analysis of atmospheric variations from ground-based observations 1h 30mIn year 2016, total column ozone levels continue to be influenced by the remaining levels of the man-made ozone depleting substances in the atmosphere. Ozone recovery is a much more subtle process as compared to the ozone depletion of the 1980s. The quality of ozone observations is important for understanding and interpreting of the trends. The interannual ozone variability is driven by various natural and climate related forcing. The sampling limitation of the ground-based networks complicates analysis of the state of ozone recovery globally and locally. Therefore, the detection of the recovery rates needs to be addressed with understanding of the measurement uncertainties. In the other hand, surface ozone is a greenhouse gas and pollutant detrimental to human health and crop and vegetation productivity. The TOAR (Tropospheric Ozone Assessment Report) is designed to address the role of surface ozone in Earth's atmospheric chemistry processes. Both total column and surface ozone variations estimated using ground-based stations are challenged by data inhomogeneity in time and by the irregularity of the spatial distribution of stations, as well as by interruptions in observation records. Understanding and measuring the inherent uncertainty in long-terms ozone changes is crucial for the understanding of recovery of ozone layer and effects of climate change on ozone recovery. We conduct a spatial and temporal trend analysis using the generalized additive mixed model (GAMM) analysis. We illustrate the methodology to the SBUV and the TOAR dataset.Speaker: Dr Kai-Lan Chang (NOAA)
-
17:30
-
10:00
→
12:00
-
-
08:30
→
09:00
Preparation (LOTUS coordination team) Small LATMOS meeting room, 3rd floor, corridor 45-46
Small LATMOS meeting room, 3rd floor, corridor 45-46
-
09:00
→
10:30
Discussions MIDI & ROAST Room 108, 1st floor, C 44-54
Room 108, 1st floor, C 44-54
- 09:00
- 09:10
- 09:20
- 09:30
- 09:40
- 09:50
- 10:00
-
10:30
→
11:00
Coffee and tea 30m
-
11:00
→
12:30
Discussions MIDI & ROAST Room 108, 1st floor, C 44-54
Room 108, 1st floor, C 44-54
-
12:30
→
14:00
Lunch 1h 30m
-
14:00
→
15:30
Discussions MIDI & ROAST Room 108, 1st floor, C 44-54
Room 108, 1st floor, C 44-54
-
15:30
→
16:00
Coffee and tea 30m
-
16:00
→
17:30
Discussions MIDI & ROAST Room 108, 1st floor, C 44-54
Room 108, 1st floor, C 44-54
-
19:00
→
21:30
Dinner 2h 30m
-
08:30
→
09:00
-
-
08:30
→
09:00
Preparation (LOTUS coordination team) Small LATMOS meeting room, 3rd floor, corridor 45-46
Small LATMOS meeting room, 3rd floor, corridor 45-46
-
09:00
→
10:30
Discussions MIDI & ROAST Room 108, 1st floor, C 44-54
Room 108, 1st floor, C 44-54
-
10:30
→
11:00
Coffee and tea 30m
-
11:00
→
12:30
Discussions MIDI & ROAST Room 108, 1st floor, C 44-54
Room 108, 1st floor, C 44-54
-
12:30
→
14:00
Lunch 1h 30m
-
14:00
→
15:30
LOTUS Report Room 108, 1st floor, C 44-54
Room 108, 1st floor, C 44-54
-
15:30
→
16:00
Coffee and tea 30m
-
16:00
→
17:30
Open issues & planning Room 108, 1st floor, C 44-54
Room 108, 1st floor, C 44-54
-
08:30
→
09:00


